Unleashing the Magic of Independent Component Analysis (ICA): A Fun and Friendly Guide
Hizkia Simaremare
∙29 November 2024
Imagine strolling into your favorite coffee shop on a sunny afternoon. As you take your seat, the delightful chaos of sounds surrounds you: the barista frothing milk, the hum of conversation, the clinking of cups, and the occasional espresso machine hiss. Your brain, a remarkable sound engineer, can effortlessly pick out each distinct sound. But how does this relate to data science? Enter Independent Component Analysis (ICA), the brain's secret weapon, brought to the world of data.
What is ICA and Why Should You Care?
Independent Component Analysis, or ICA for short, is a computational technique used to uncover hidden factors that underlie sets of random variables, measurements, or signals. In simpler terms, ICA helps us separate mixed signals into their original, independent sources. Just like your brain distinguishes the coffee shop sounds, ICA can untangle the complex data we encounter in the real world.
 (Source : https://www.linkedin.com/pulse/perils-noisy-cafe-daniel-mccullen/)
Imagine you have a playlist that’s a chaotic mix of different songs playing simultaneously. Your goal? Extract each song and listen to them individually. ICA is your magic wand.
The Science Behind the Magic
ICA operates on the principle that the mixed signals are actually combinations of independent source signals. By leveraging statistical properties, ICA identifies and separates these sources. Here’s a bit more on how it works without getting too deep into the math:
-
Mixed Signals: Think of this as your messy playlist. Each song is mixed with others.
-
Statistical Independence: ICA assumes that the original sources (the songs) are statistically independent from each other.
-
Maximizing Independence: The algorithm rearranges the mixed signals to maximize their statistical independence, effectively separating the individual songs from the playlist.
ICA in Action: The Cocktail Party Problem
Let’s dive into a classic example: the cocktail party problem. Imagine you're at a lively party, trying to focus on a single conversation amidst the background chatter. ICA can help here too!
Step-by-Step Breakdown:
-
Recording the Mix: Microphones placed around the room capture the overall sound, but each recording is a mix of all conversations.
-
Applying ICA: The ICA algorithm processes these recordings, treating each as a mixture of independent sources.
-
Separating Sources: Voila! The algorithm separates the individual conversations, allowing you to tune into the one that interests you.
Why is ICA Important in Data Science?
ICA isn’t just a nifty party trick. It has real-world applications that are both exciting and impactful:
-
Brain Imaging: In neuroscience, ICA helps in analyzing fMRI and EEG data to isolate brain activity patterns.
-
Financial Data: Traders use ICA to separate signals in stock prices, helping to identify underlying market trends.
-
Image Processing: ICA is used to remove noise from images, improving clarity and detail.
But wait, there's more! Imagine being a detective with a superpower that lets you see through walls. ICA is like that superpower for data detectives. It lets you peer into the hidden structure of your data, revealing insights that would otherwise be impossible to detect. Whether you're trying to understand the complex interactions in a neural network, or decode the mysteries of market behavior, ICA is your trusty sidekick.
So, put on your detective hat, grab your magnifying glass, and get ready to uncover the secrets lurking within your datasets. The thrill of discovery awaits, and ICA is your key to unlocking it all!
Getting Hands-On with ICA
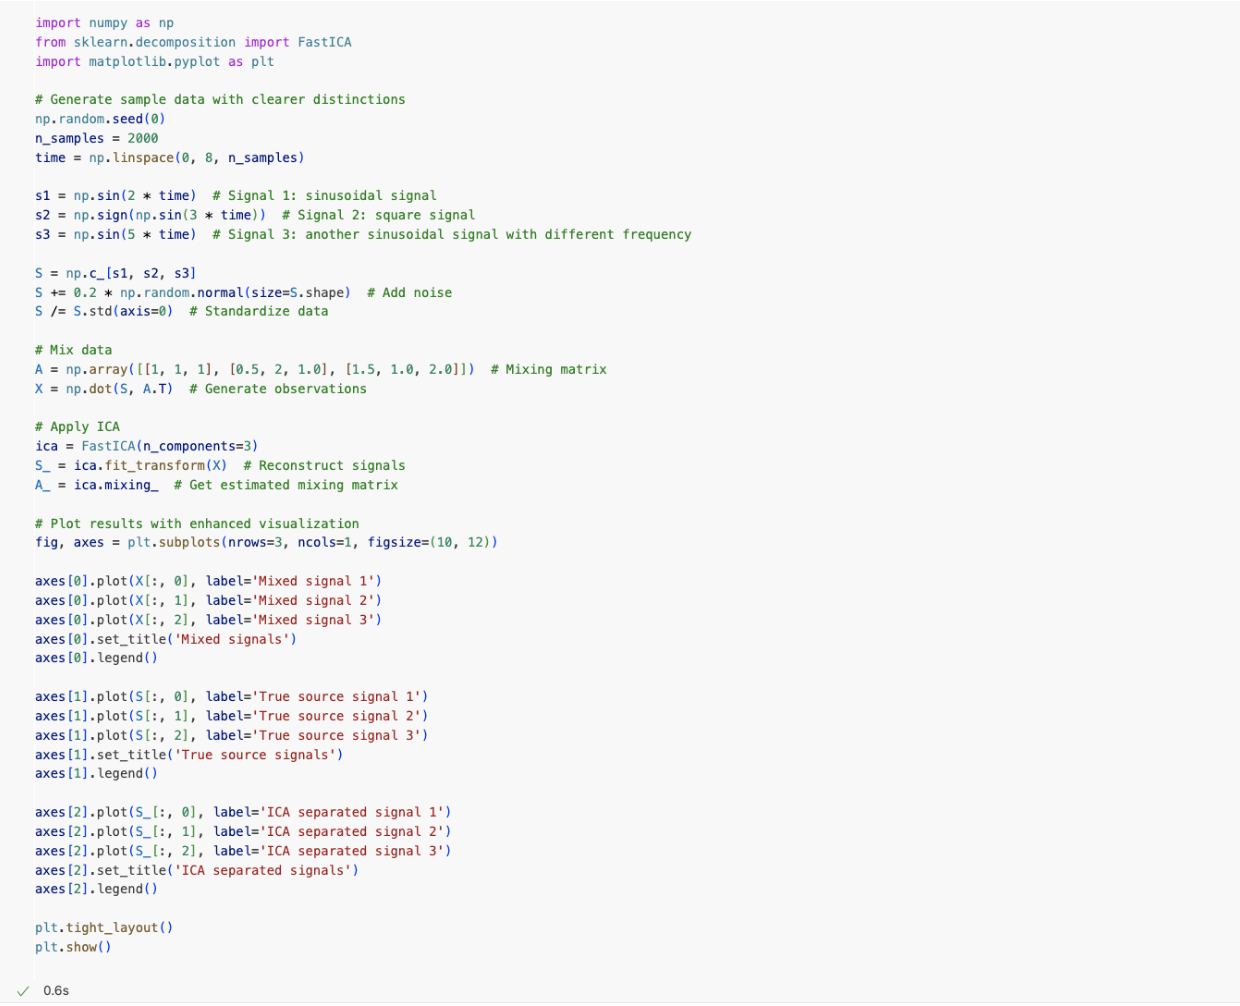
Ready to see ICA in action? Let’s take a friendly stroll through a simplified example using Python and the FastICA algorithm from the sklearn library.
Setting Up
First, ensure you have sklearn installed. If not, run:

The Code
Here’s a simple script to demonstrate ICA:
Plots Explanation
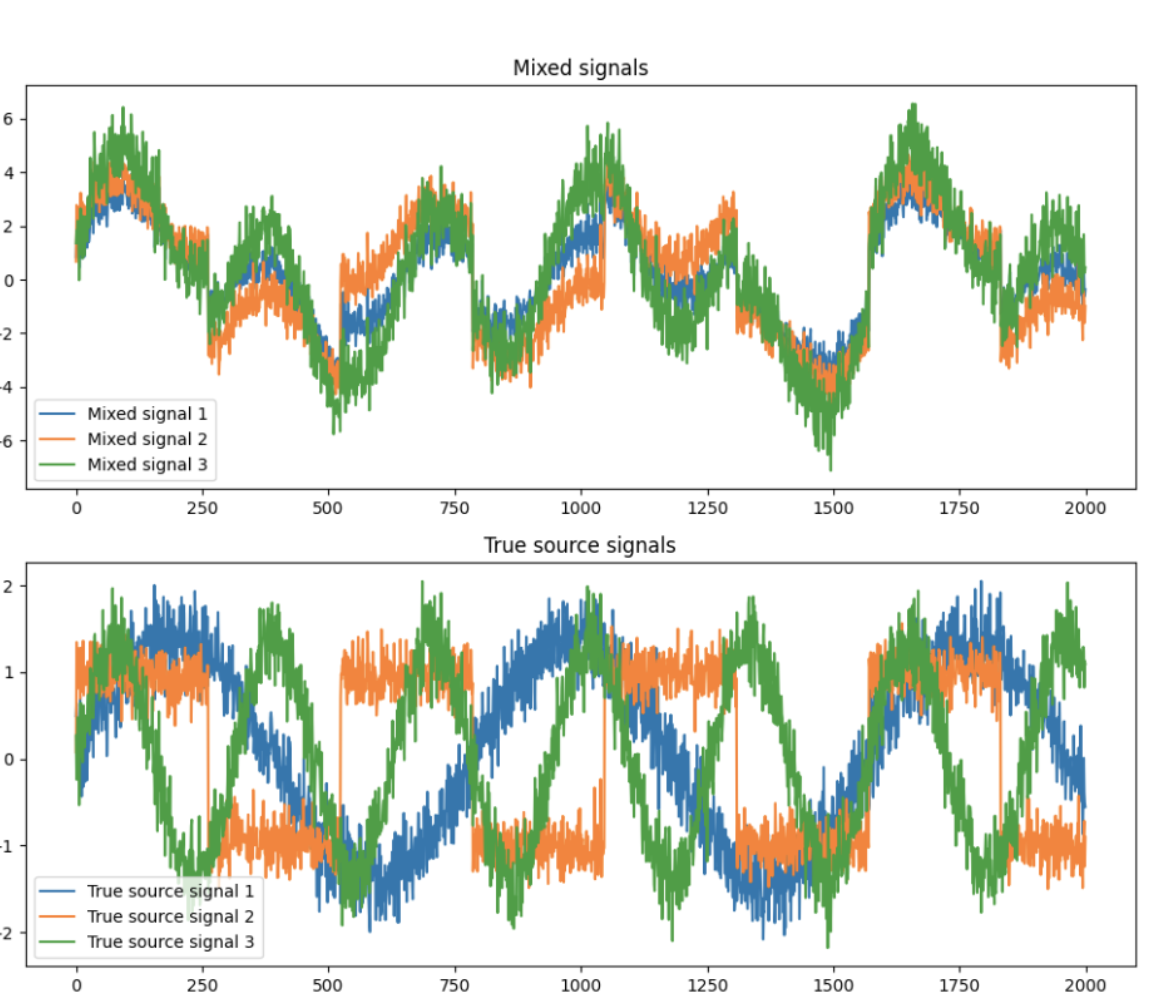
Mixed Signals (Top Plot)
-
Complexity and Overlap: The signals are heavily overlapped and intertwined, making it difficult to distinguish individual patterns. This is because each recorded signal is a combination of all three source signals.
-
Noise: Added noise increases the complexity of the signal, making separation more challenging.
True Source Signals (Middle Plot)
-
Distinct Patterns: Each signal shows a clear and distinct pattern:
-
True Source Signal 1 (Blue): A sinusoidal wave with a specific frequency.
-
True Source Signal 2 (Orange): A square wave.
-
True Source Signal 3 (Green): Another sinusoidal wave with a different frequency.
-
Independence: The signals do not overlap and are independent of each other, showcasing the different characteristics of each source.
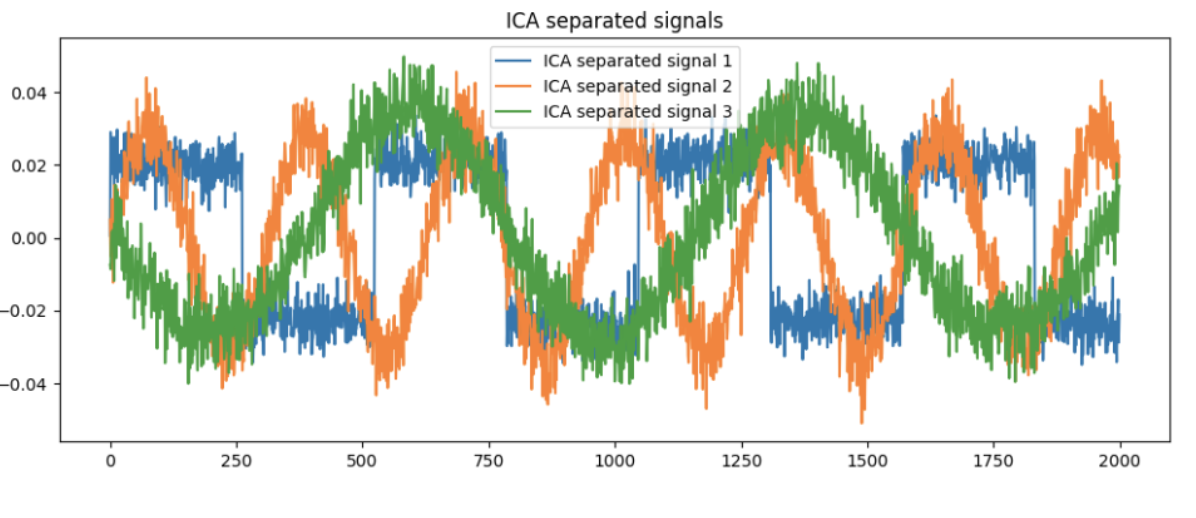
ICA Separated Signals (Bottom Plot)
-
Recovered Patterns: The separated signals closely resemble the true source signals:
-
ICA Separated Signal 1 (Blue): Matches the pattern of the sinusoidal wave from True Source Signal 1.
-
ICA Separated Signal 2 (Orange): Matches the pattern of the square wave from True Source Signal 2.
-
ICA Separated Signal 3 (Green): Matches the pattern of the sinusoidal wave from True Source Signal 3.
-
Amplitude Differences: The amplitude of the separated signals might be different. For instance, the peaks and troughs might be scaled differently compared to the true source signals.
-
Residual Noise: There might be small amounts of noise or artifacts in the separated signals that are not present in the true source signals.
Highlighting the Differences
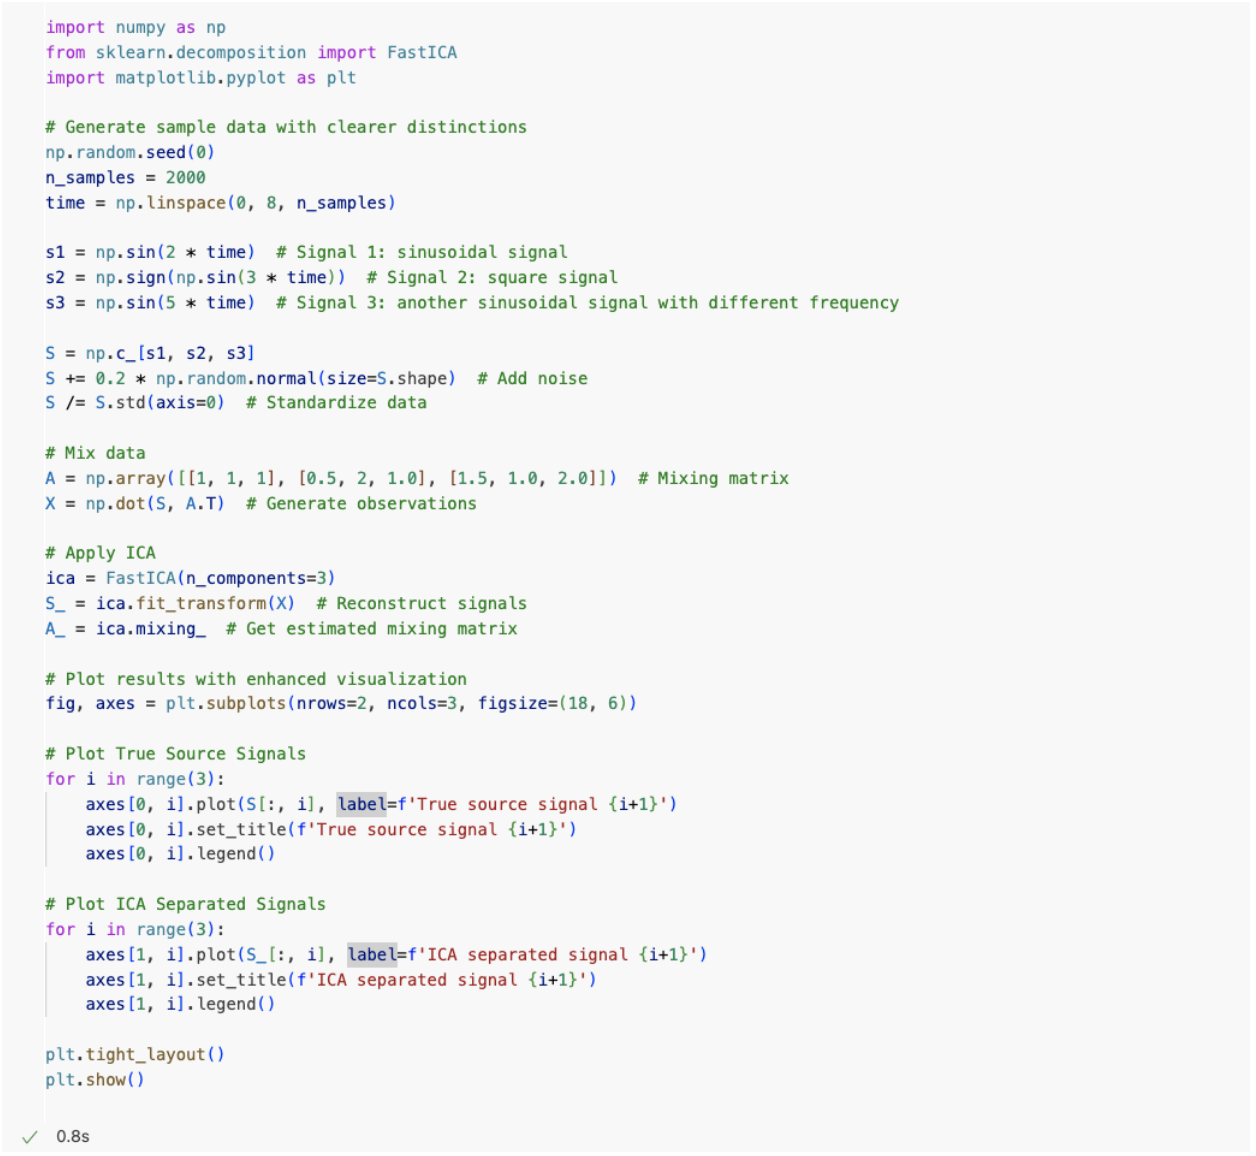
To further highlight the differences between the true source signals and the ICA-separated signals, we can plot them side by side.
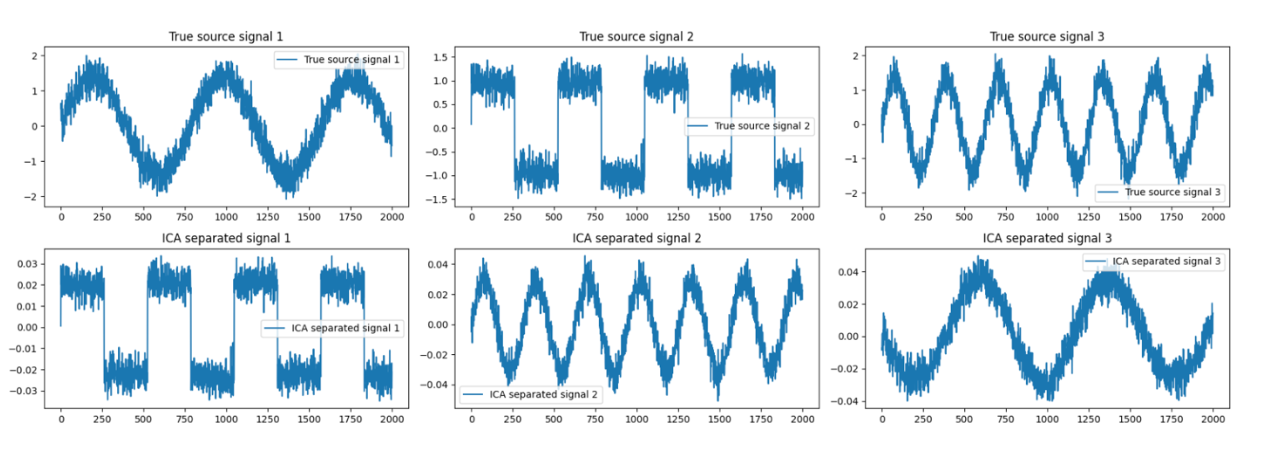
Key Differences to Observe:
-
Amplitude Scaling: Notice how the amplitude of the ICA-separated signals might be different from the true source signals.
-
Order of Signals: The order of the ICA-separated signals may not match the order of the true source signals.
-
Residual Noise: ICA-separated signals might have some residual noise or small artifacts not present in the true source signals.
Wrapping It Up
Independent Component Analysis is a powerful technique that simplifies the chaos of mixed signals into understandable, independent sources. Whether it's isolating brain activity patterns, analyzing financial trends, or improving image quality, ICA's applications are vast and impactful. So next time you find yourself trying to make sense of a complex mix, remember: ICA is your go-to tool, ready to work its magic!
Now, go forth and impress your friends with your newfound ICA knowledge – and maybe even solve a cocktail party problem or two!
Happy data adventures!
bagikan
ARTIKEL TERKAIT

 (Source :