


Beyond Coordinates: Discovering Geospatial Insights with Folium’s Power
Hieremias Kevin Juwantoro
∙23 February 2024

You may think that mapping your data is impossible if you don’t have longitude and latitude columns. But with Folium, a Python library that lets you create interactive maps easily, you can do it even without those coordinates. In this article, we’ll show you how to use Folium to map your data and geocode your data using other information like address, city, country, or postal code. We’ll also talk about various plugins and features of Folium that can make your map more appealing and informative.
Folium is a powerful Python library that enables you to create interactive maps. It is based on Leaflet.js, a popular JavaScript library for interactive maps. With Folium, you can make maps and add various elements like markers, polygons, and popups to visualize your data in a geospatial context. In this article, we’ll focus on a specific challenge: mapping data on a map when you don’t have longitude and latitude columns. We’ll show you how to overcome this challenge by geocoding your data using other information, like address, city, country, or postal code. By using the Nominatim geocoding service, we can get the latitude and longitude coordinates for a given location and use them to map our data on a map.
Setting Up Folium Before we start geocoding and mapping data, let’s make sure that we have Folium installed. You can install it using pip:
pip install folium
Once Folium is installed, we can import it into our Python script or Jupyter Notebook and start making maps. Here’s a simple example to get you started:
import folium
Finding Geospatial Coordinates with Nominatim
To map our data, we need to get the latitude and longitude coordinates for each location in our dataset. If our data does not have longitude and latitude columns, we can use geocoding to get these coordinates from other information, such as address, city, country, or postal code. One popular geocoding service that we can use is
Nominatim = It is a free and open-source service provided by OpenStreetMap. Nominatim lets us make HTTP GET requests to its API endpoint and get location information in JSON format.
import requests from geopy.geocoders import Nominatim To start, let’s define a function called get_location_coordinates() that takes a location name as input and returns its latitude and longitude coordinates:
def get_country_coordinates(country_name): geolocator = Nominatim(user_agent="geoapi")
# Use requests without SSL verification
session = requests.Session()
session.verify = False

url = f"https://nominatim.openstreetmap.org/search?q={country_name}&format=json&limit=1"
response = session.get(url)
if response.ok:
    data = response.json()
    if data:
        latitude = float(data[0]['lat'])
        longitude = float(data[0]['lon'])
        return latitude, longitude
return None, None
In this function, we build the URL by adding the location parameter to the Nominatim API endpoint. We then make an HTTP GET request using the requests library and parse the JSON response to get the latitude and longitude values. Finally, we return these values or None, None if the data is not available or if there is an error.
Adding Geospatial Coordinates to Your Data
Now that we have a function to get the latitude and longitude coordinates for a given location, let’s see how we can add these coordinates to our data. Assuming we have a DataFrame named df with a column named ‘Location’ that has the locations we want to geocode, we can loop over each location, call the get_location_coordinates()
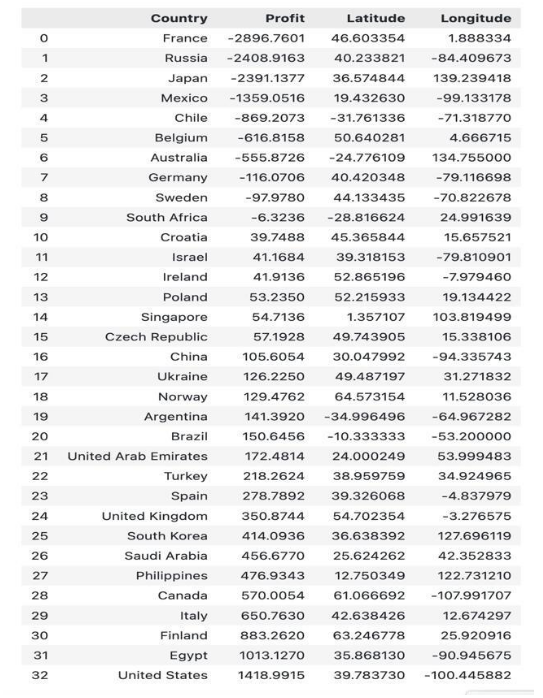
function, and append the coordinates to separate lists: latitude = [] longitude = [] for i in df_Country['Country']: lat, long = get_country_coordinates(i) latitude.append(lat) longitude.append(long)
df_Country['Latitude'] = latitude df_Country['Longitude'] = longitude
df_Country In this code snippet, we create two empty lists, latitude, and longitude, to store the coordinates. We then loop over each location in the ‘Location’ column of the DataFrame and call the get_location_coordinates() function to get the coordinates. Finally, we add two new columns, ‘Latitude’ and ‘Longitude’, to the DataFrame and fill them with the corresponding coordinates.
Visualize Data on the Map
Mapping Data on a Map Now that we have the latitude and longitude coordinates for each location in our dataset, we can map our data on a map using Folium. To do this, we’ll create a map object and add markers for each location. Let’s start by creating a map centered around the first location in our dataset:
#Create a Folium map centered around the first coordinate pair world_map = folium.Map(location=[df_Country['Latitude'][0], df_Country['Longitude'][0]], zoom_start=3)
Customizing Markers and Colors
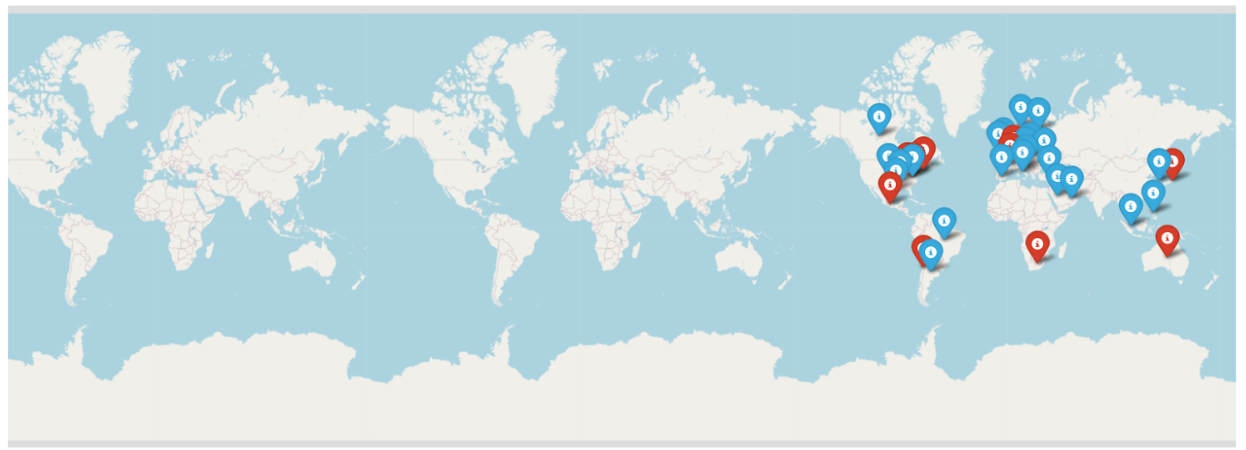
To make our map more visually appealing and informative, we can customize the markers and colors based on certain criteria. For example, we might want to use different marker colors for locations with positive and negative values. Here's an example of how we can customize the markers based on the profit values in my dataset:
#Add markers for each country for i in range(len(df_Country)): # Determine marker color based on profit value if df_Country['Profit'][i] < 0: marker_color = 'red' # Markers with negative profit values will be red else: marker_color = 'blue' # Markers with non-negative profit values will be blue
folium.Marker(
    location=[df_Country['Latitude'][i], df_Country['Longitude'][i]],
    popup=f"Country: {df_Country['Country'][i]}, Profit: {df_Country['Profit'][i]}",
    tooltip=df_Country['Country'][i],
    icon=folium.Icon(color=marker_color)  # Set marker color
).add_to(world_map)
#Display the map
world_map
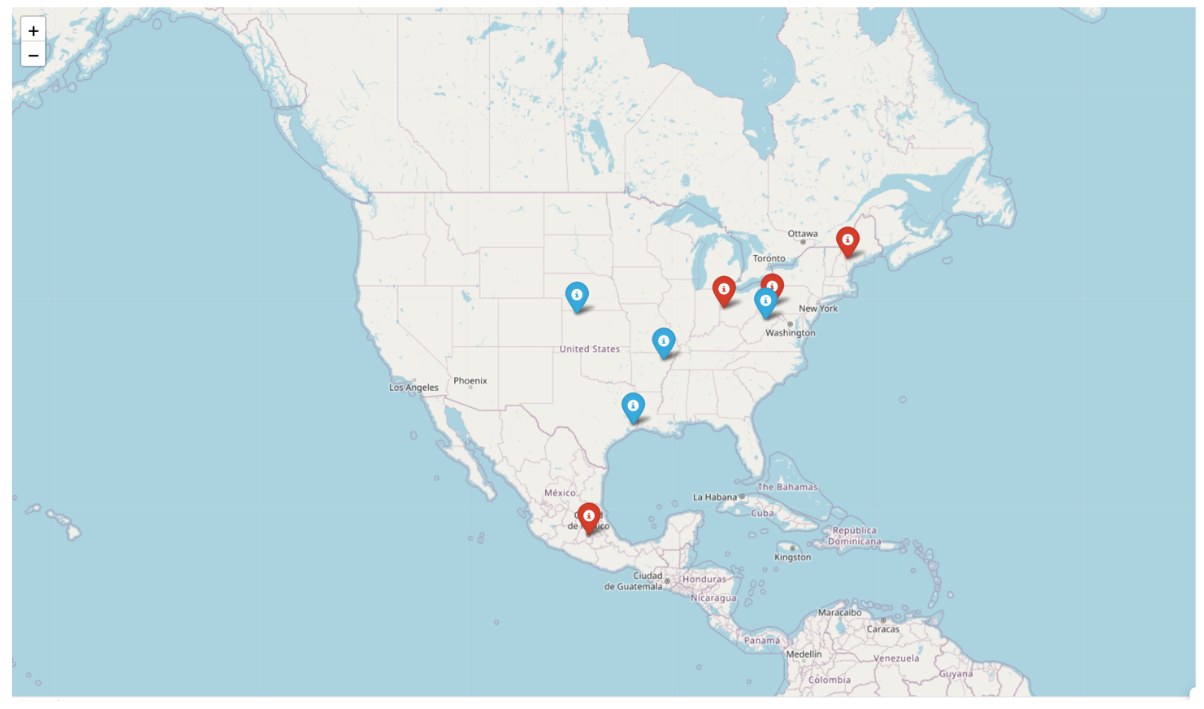 In this code snippet, we iterate over each location in our dataset and add a marker to the map. We determine the marker color based on the profit value for each location: red for negative values and blue for non-negative values. We also set the popup and tooltip content to display the location name and profit value. Finally, we add the marker to the map using the add_to() method.
In this article, we have explored how to plot data on a map using Folium, even without longitude and latitude columns. We have learned how to geocode our data using other information such as address, city, country, or postal code, and how to add the obtained geographical coordinates to our dataset. We have also seen how to visualize our data on a map and customize markers' colors.
By leveraging the power of Folium, you can create informative and visually appealing maps to visualize your data in a geospatial context. Whether you're working with sales data, demographic data, or any other type of data, Folium provides a user-friendly and flexible solution for data visualization on maps. So why wait? Start exploring Folium today and unlock the potential of geospatial data visualization!
bagikan
ARTIKEL TERKAIT


Follow Us
© 2026 Purwadhika Digital Technology School All Rights Reserved Owned by PT Purwadhika Kirana Nusantara